Case study · Provenir AI · 1datapipe · 2023–24
From API-only to a unified platform.
Lead UX/UI Designer on 1datapipe— taking Provenir AI’s data-verification product from a headless B2B API to a unified data verification and insights platform. Research through 0→1 MVP launch, with a design system, scoring UI, batch automation, anomaly detection, and a documentation hub now in live commercial use.
- Role
- Lead UX / UI Designer
- Client
- Provenir AI · 1datapipe
- Year
- 2023 — 2024
- Status
- Shipped · 0 → 1 MVP
About 1datapipe
360° customer insights, at API scale.
1datapipe is an AI-powered platform that delivers 360° customer insights using over 500 data attributes — helping businesses reduce identity fraud, assess credit and payment risk, and support financial inclusion worldwide.
The problem
An API without a face.
1datapipe shipped as an API-only B2B solution without any user-facing platform. Clients had nowhere to test endpoints, view insights, or read documentation. Onboarding was painful, adoption was capped, and every question routed through internal engineers.
Goals & outcome
One goal, two metrics, a system to make it possible.
Goal
Design a user-centric, centralised platform for data verification, scoring, and monitoring.
Success metrics
100% B2B customer adoption · 50% faster API setup · fewer errors.
Outcome
A scalable platform and design system with faster time-to-market.
Research & key findings
Two audiences, two unmet jobs.
User surveys plus stakeholder interviews surfaced two distinct user groups — technical implementers needing a documentation hub, and non-technical analysts needing a friendly dashboard to read scores and verify profiles. Both jobs were unmet by the API-only baseline.
Required unified API visibility and dashboards.
Lacked visibility into fraud and credit scores.
Needed easy profile-verification tools.
Design principles
Three rules that everything tested against.
Usability
Accessibility and inclusion baked in — good design has to work for technical and non-technical users alike.
Consistency
Cohesive, visually consistent surfaces that build trust with B2B clients evaluating a brand-new platform.
Scalability
Adaptable to evolving user needs, new score types, and growth across markets without rewrites.
Approach
Four moves from API to platform.
- 01
Diagnose the silence
1datapipe was an API-only product with no human-facing surface. Clients couldn't onboard, test endpoints, or see results — every question went through internal engineers. The research wasn't 'do users want a dashboard?' It was 'which users, with which jobs, in what order?' Surveys + stakeholder interviews surfaced two clear personas (technical implementers and non-technical analysts) with very different needs.
- 02
Design a system, then a UI
Stood up a fully customised, scalable design system in Figma backed by Local Variables for tokens, with documentation in Zeroheight and component delivery via Storybook. The system shipped before the first product screen so every subsequent surface was systemic, not bespoke.
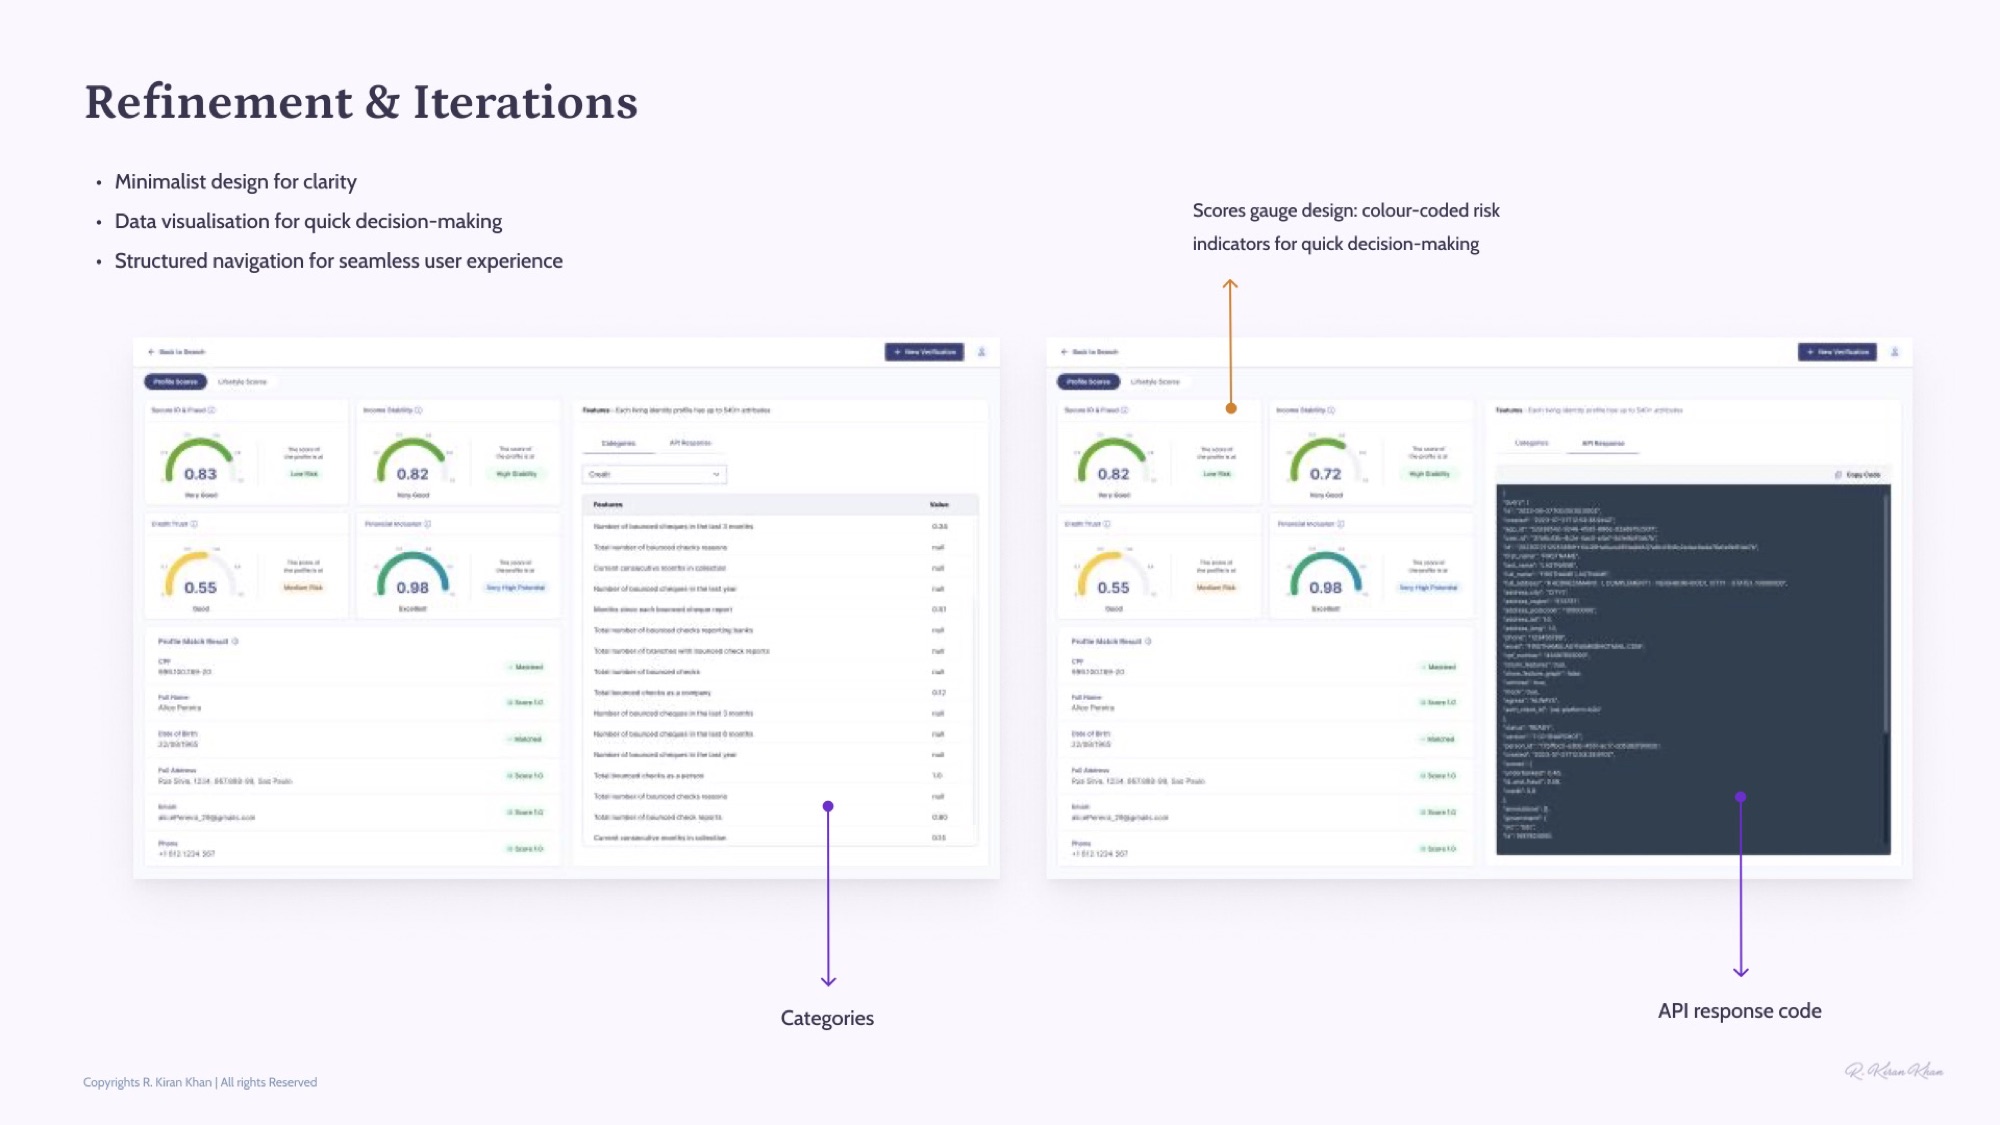
- 03
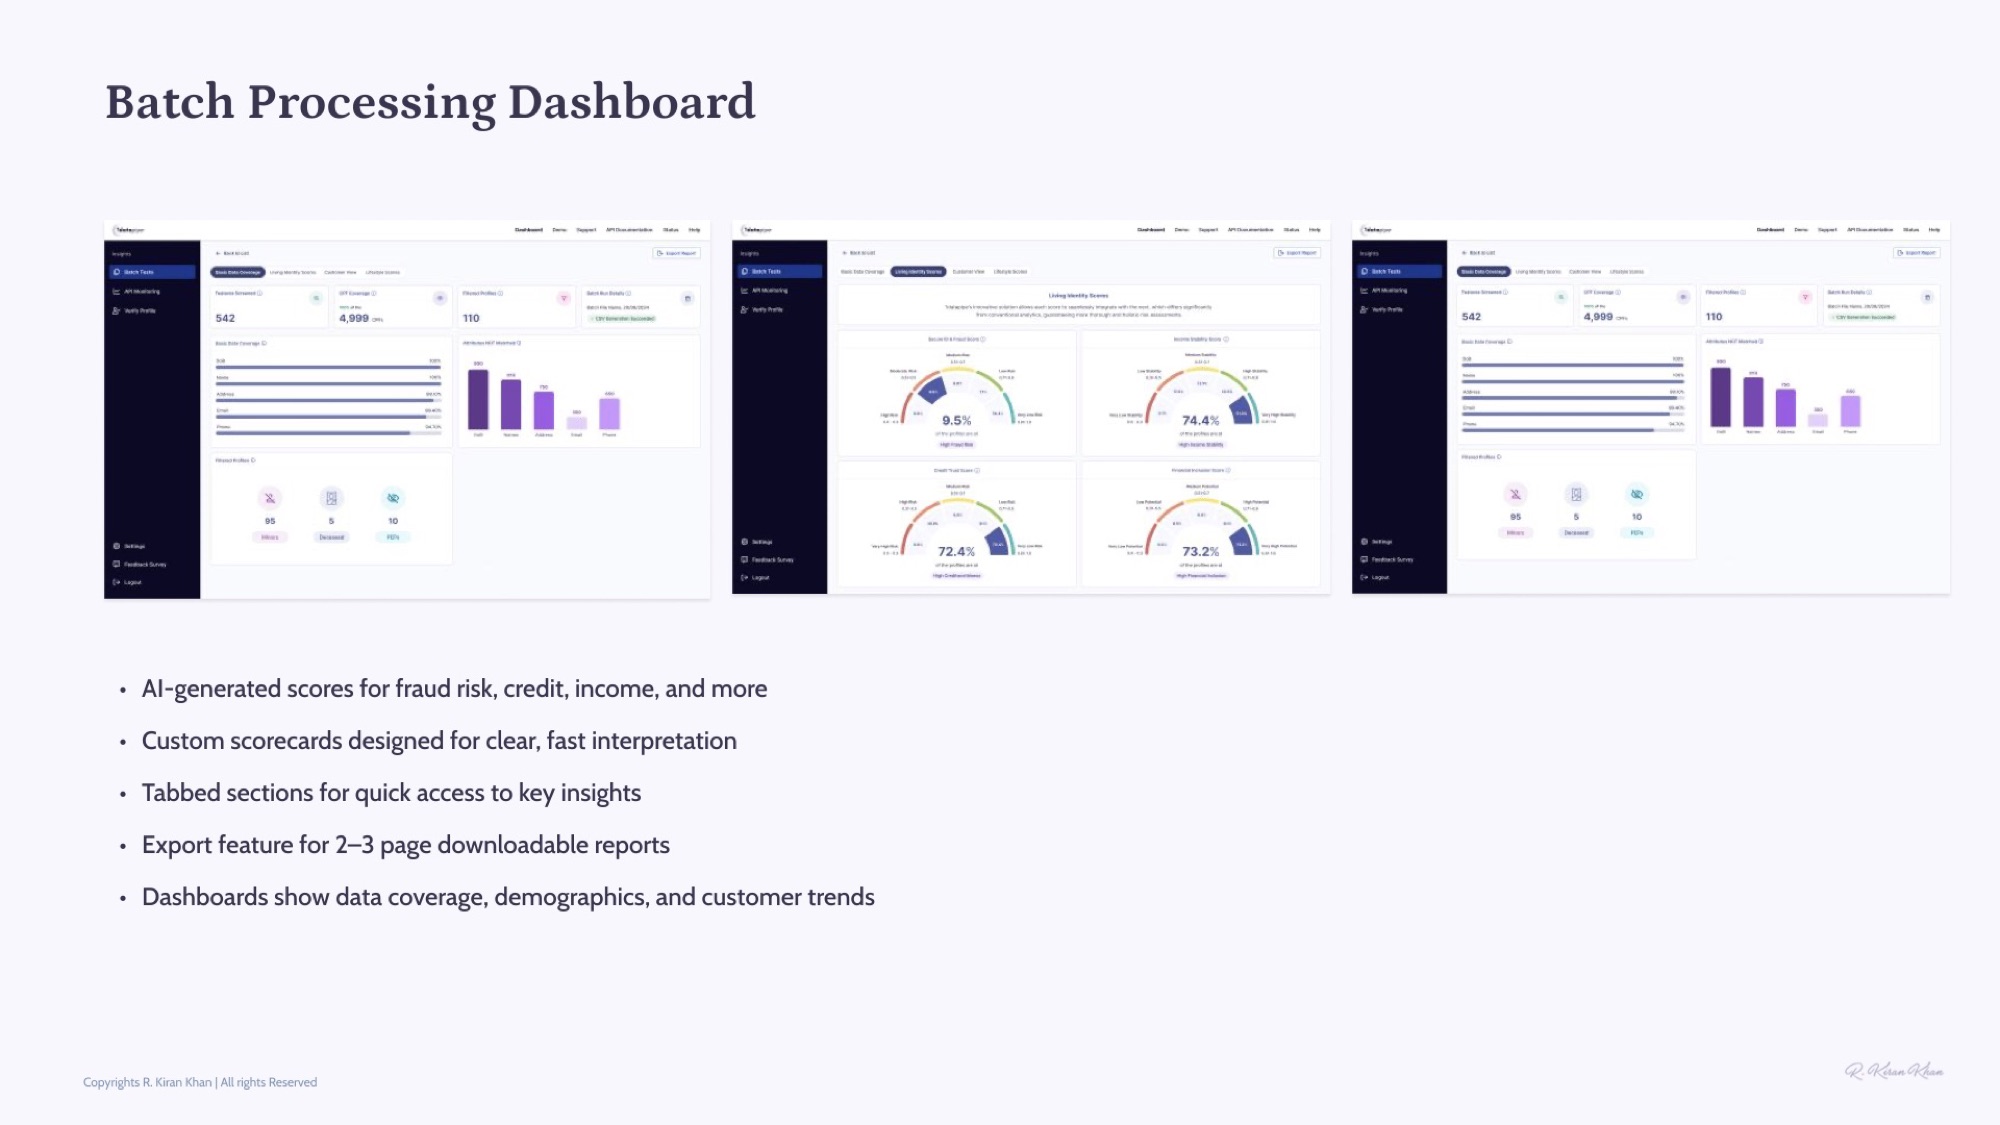
Translate scores into decisions
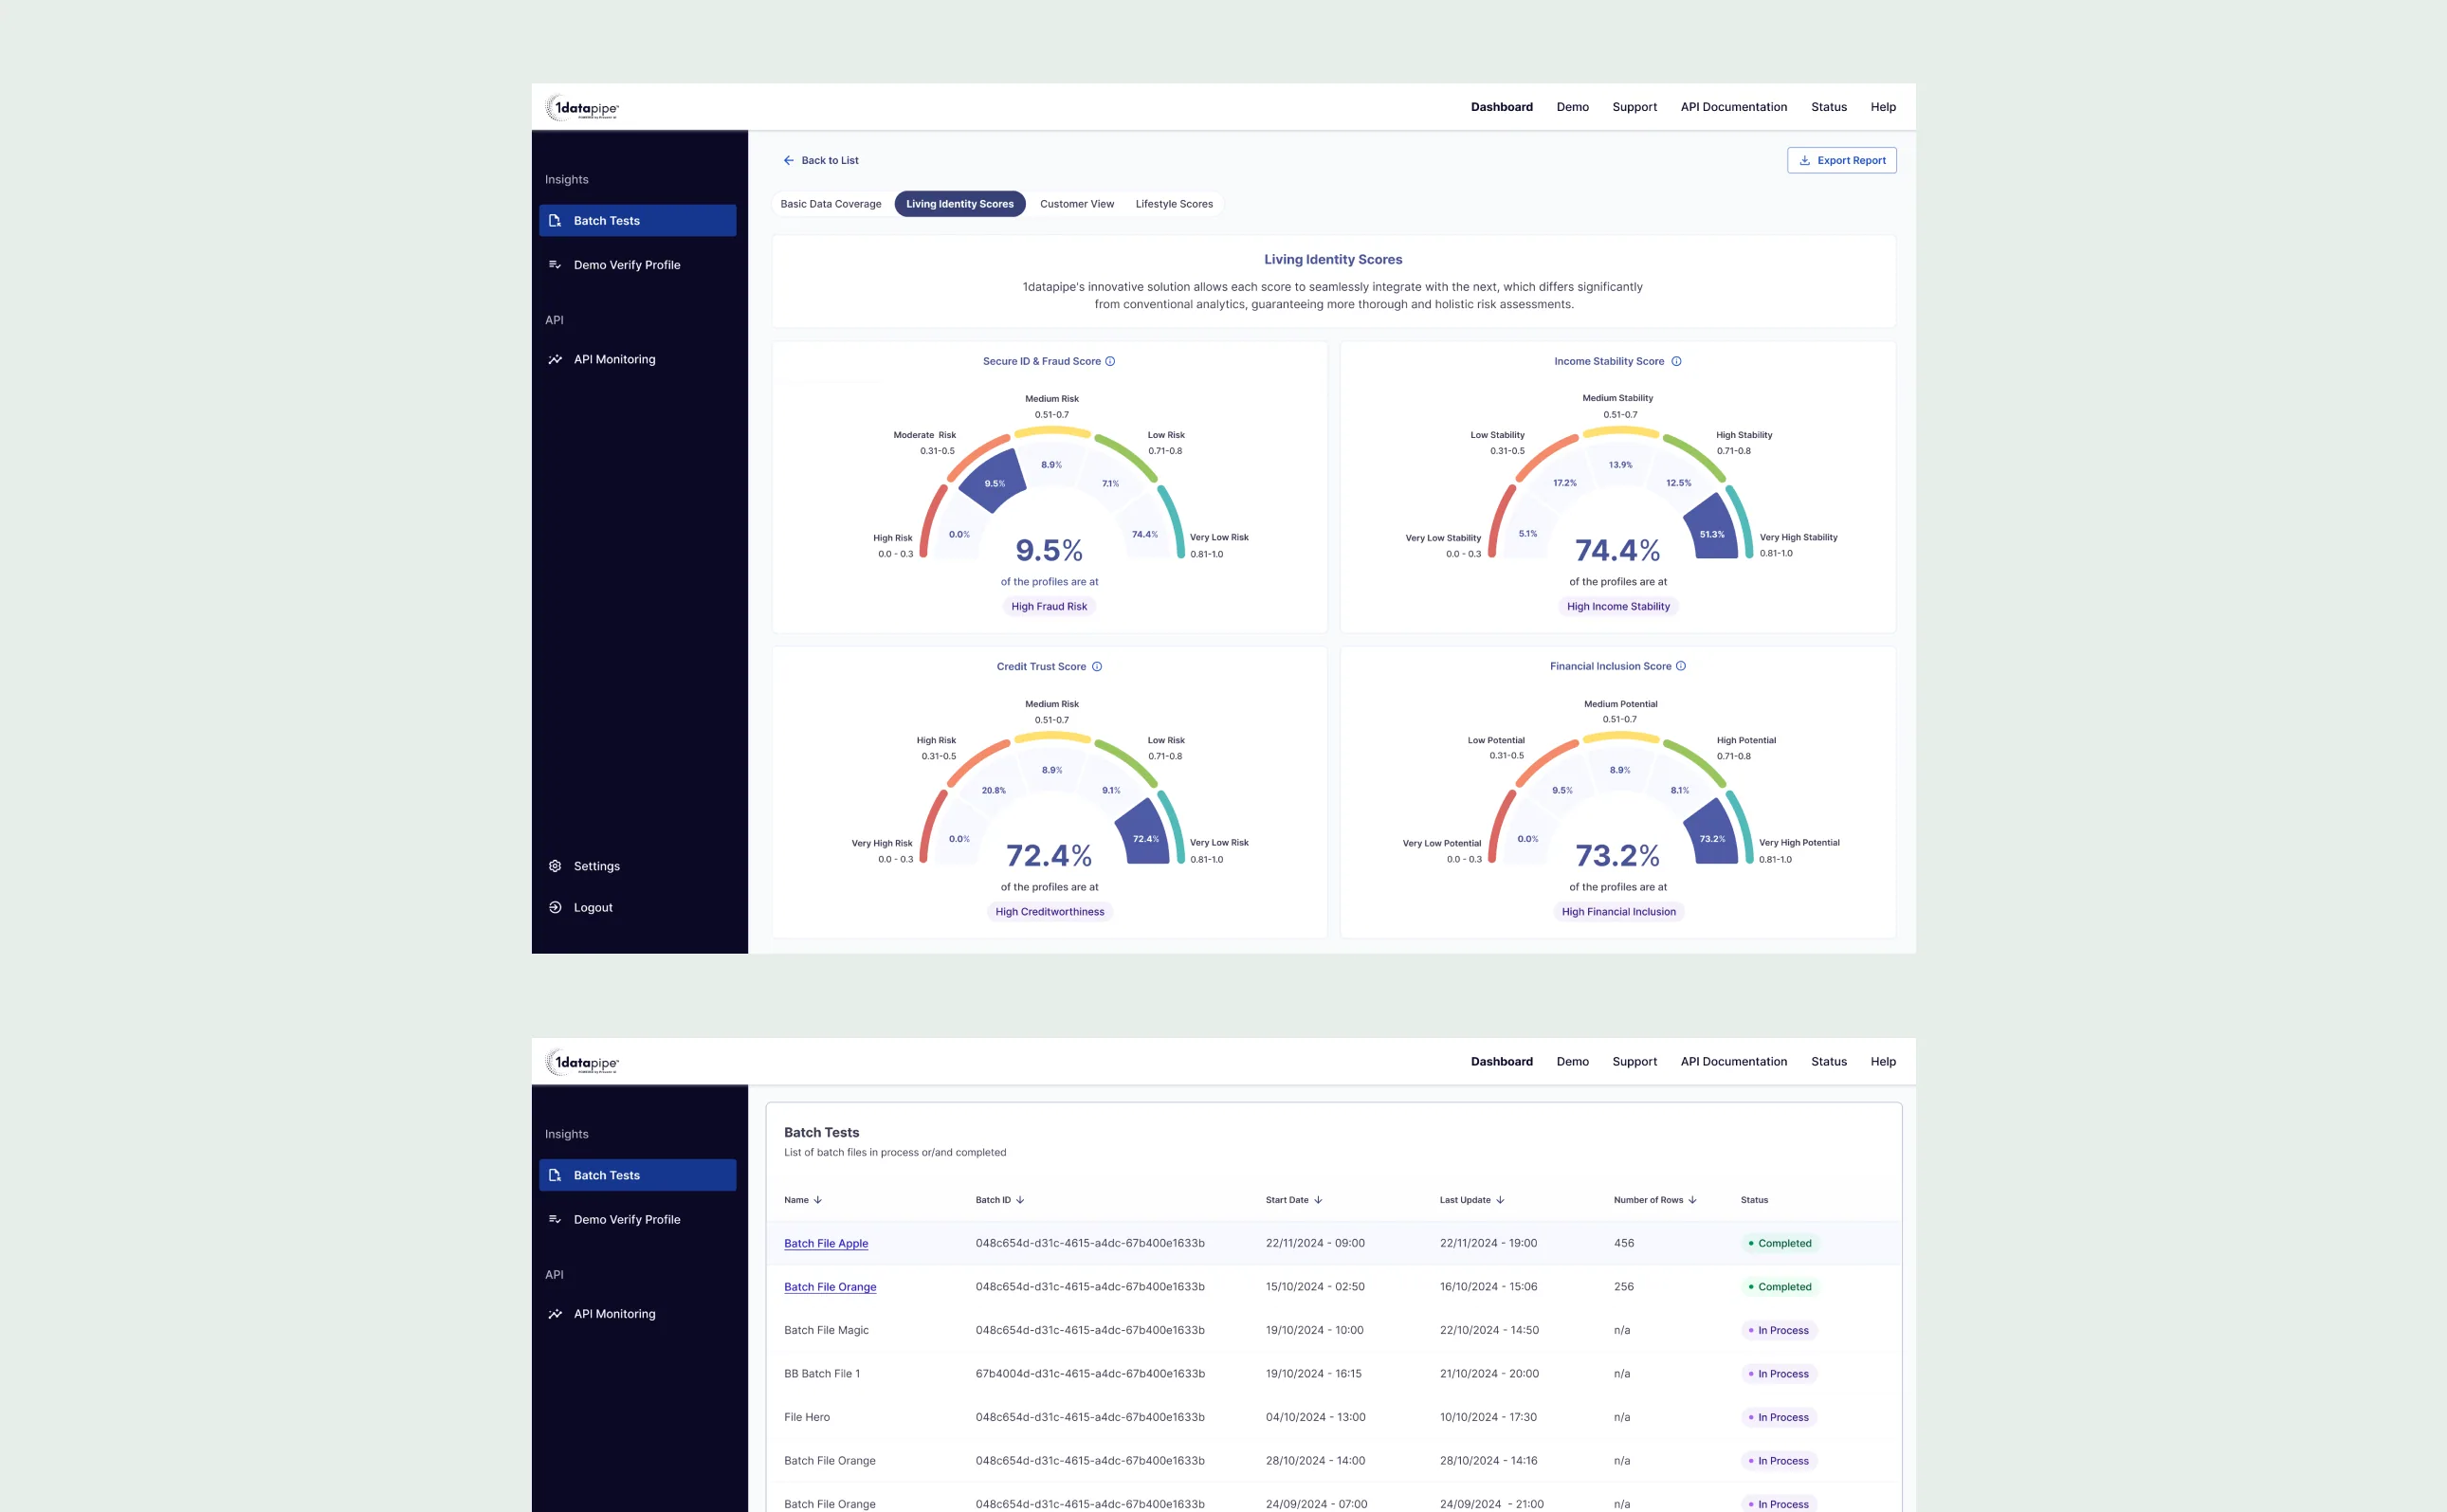
AI-generated outputs (fraud risk, credit, income stability, lifestyle scores) are only valuable if a human can act on them. Designed colour-coded gauges, scorecard layouts, and category breakdowns so analysts can read complex data at a glance and make confident decisions in seconds.
- 04
Automate the slowest pipe
The batch-reporting workflow was the team's worst-rated process — manual, error-prone, dependent on a rotating cast of data scientists. Replaced it with a self-serve dashboard with file uploads, real-time tracking, colour-coded statuses, AI-powered insights, and multi-format downloads. Removed the human bottleneck entirely.
Platform features
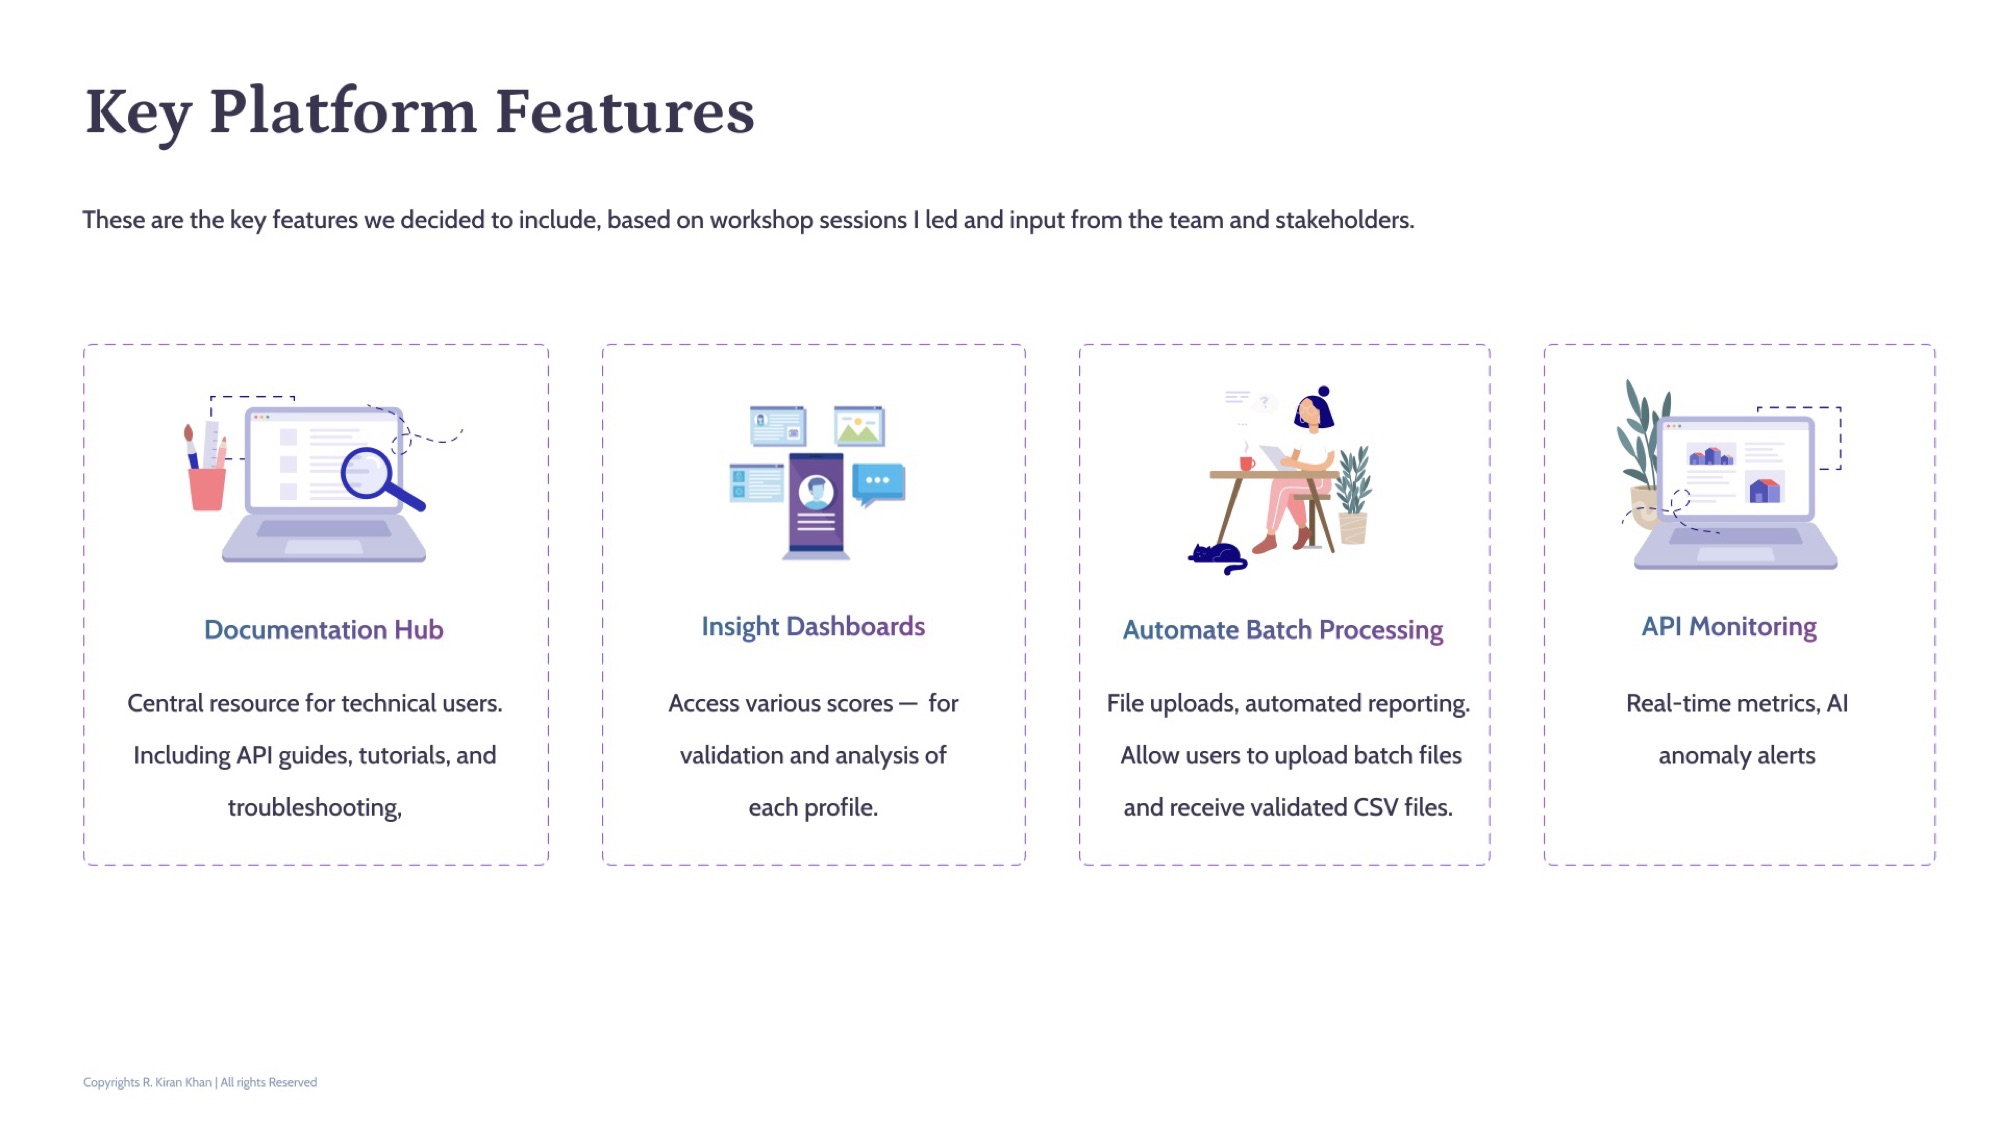
Four pillars, defined in a workshop.
Led ideation workshops with product, engineering, and data science to converge on the platform’s pillars: Insight Dashboards for profile scores, API Monitoring with real-time metrics and anomaly alerts, Documentation Hub for technical users, and Automated Batch Processing for bulk uploads and reporting.
IA + wireframes
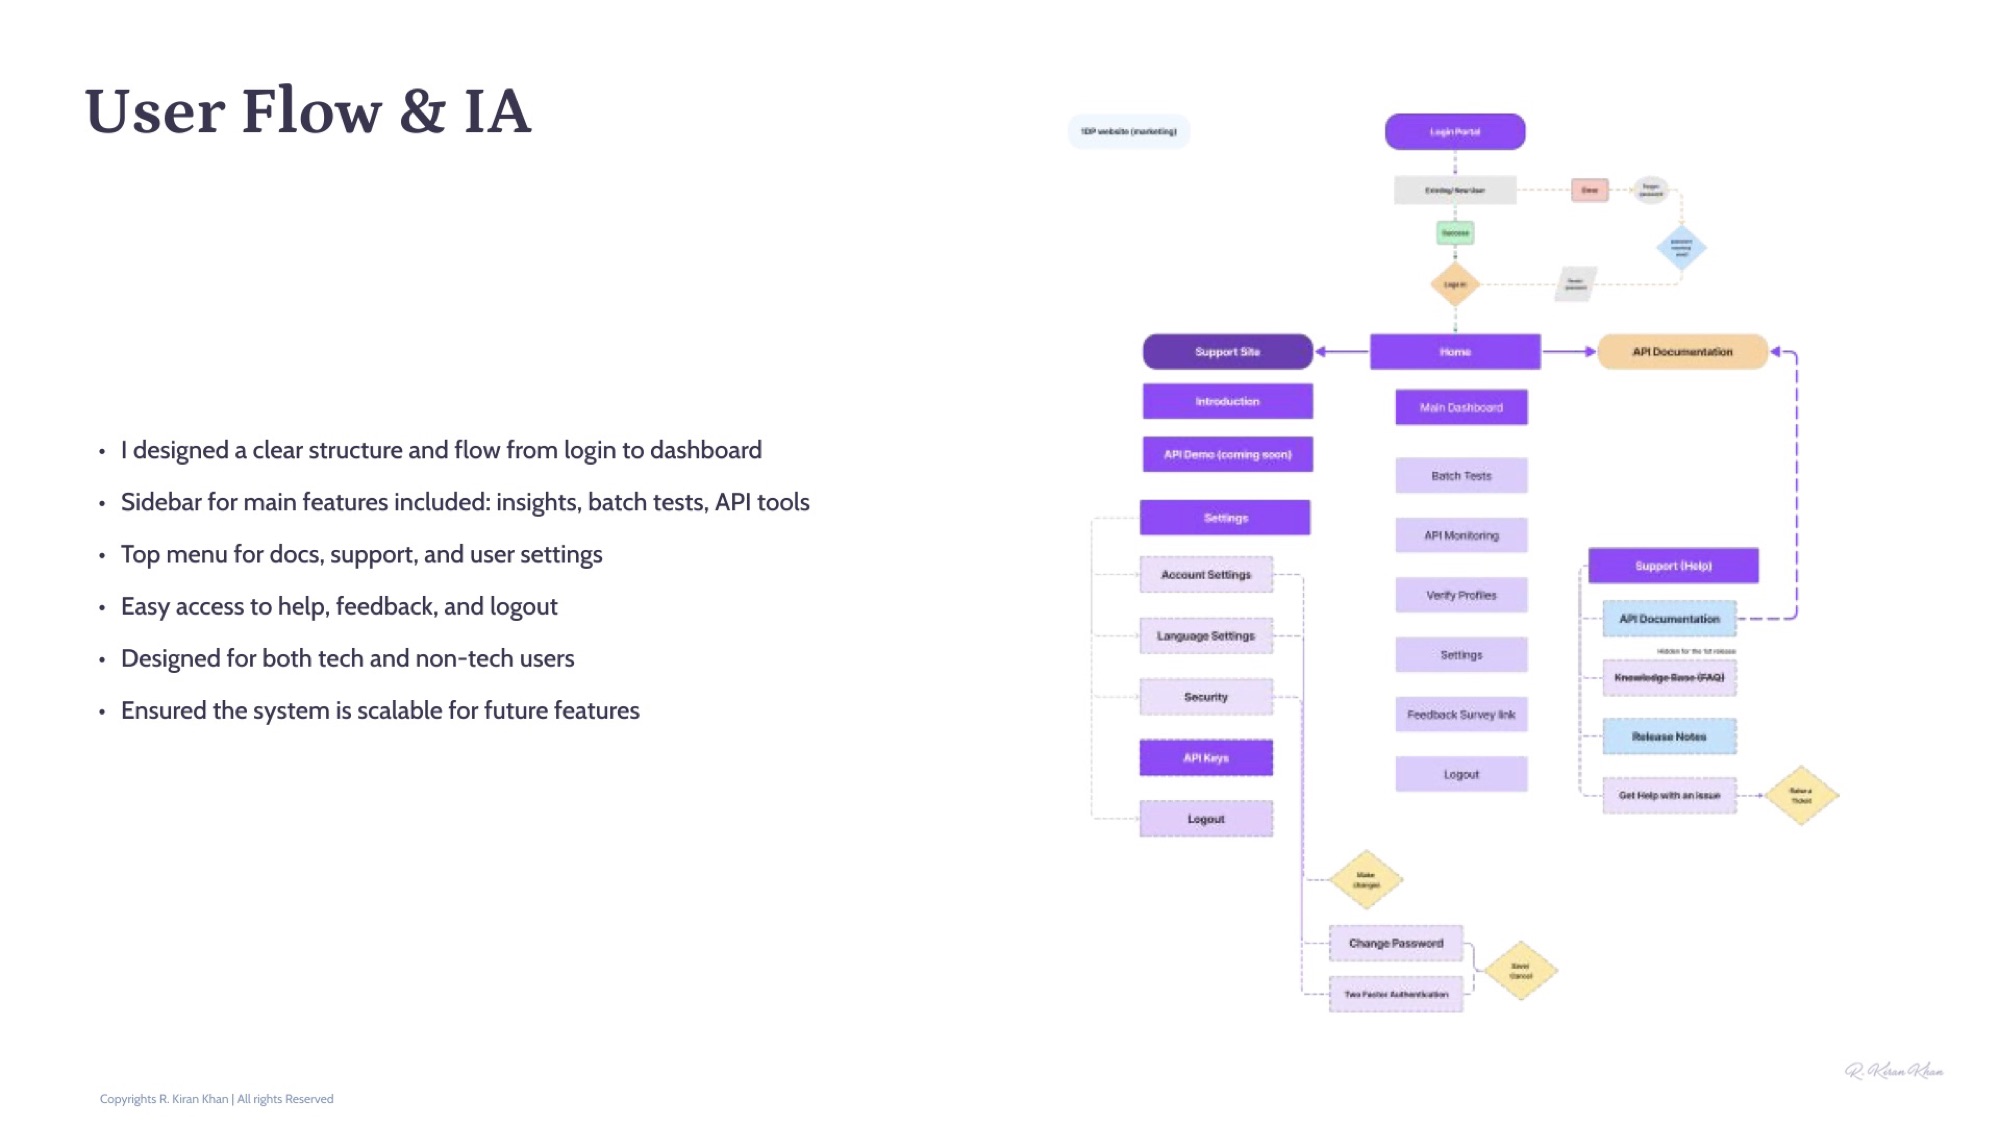
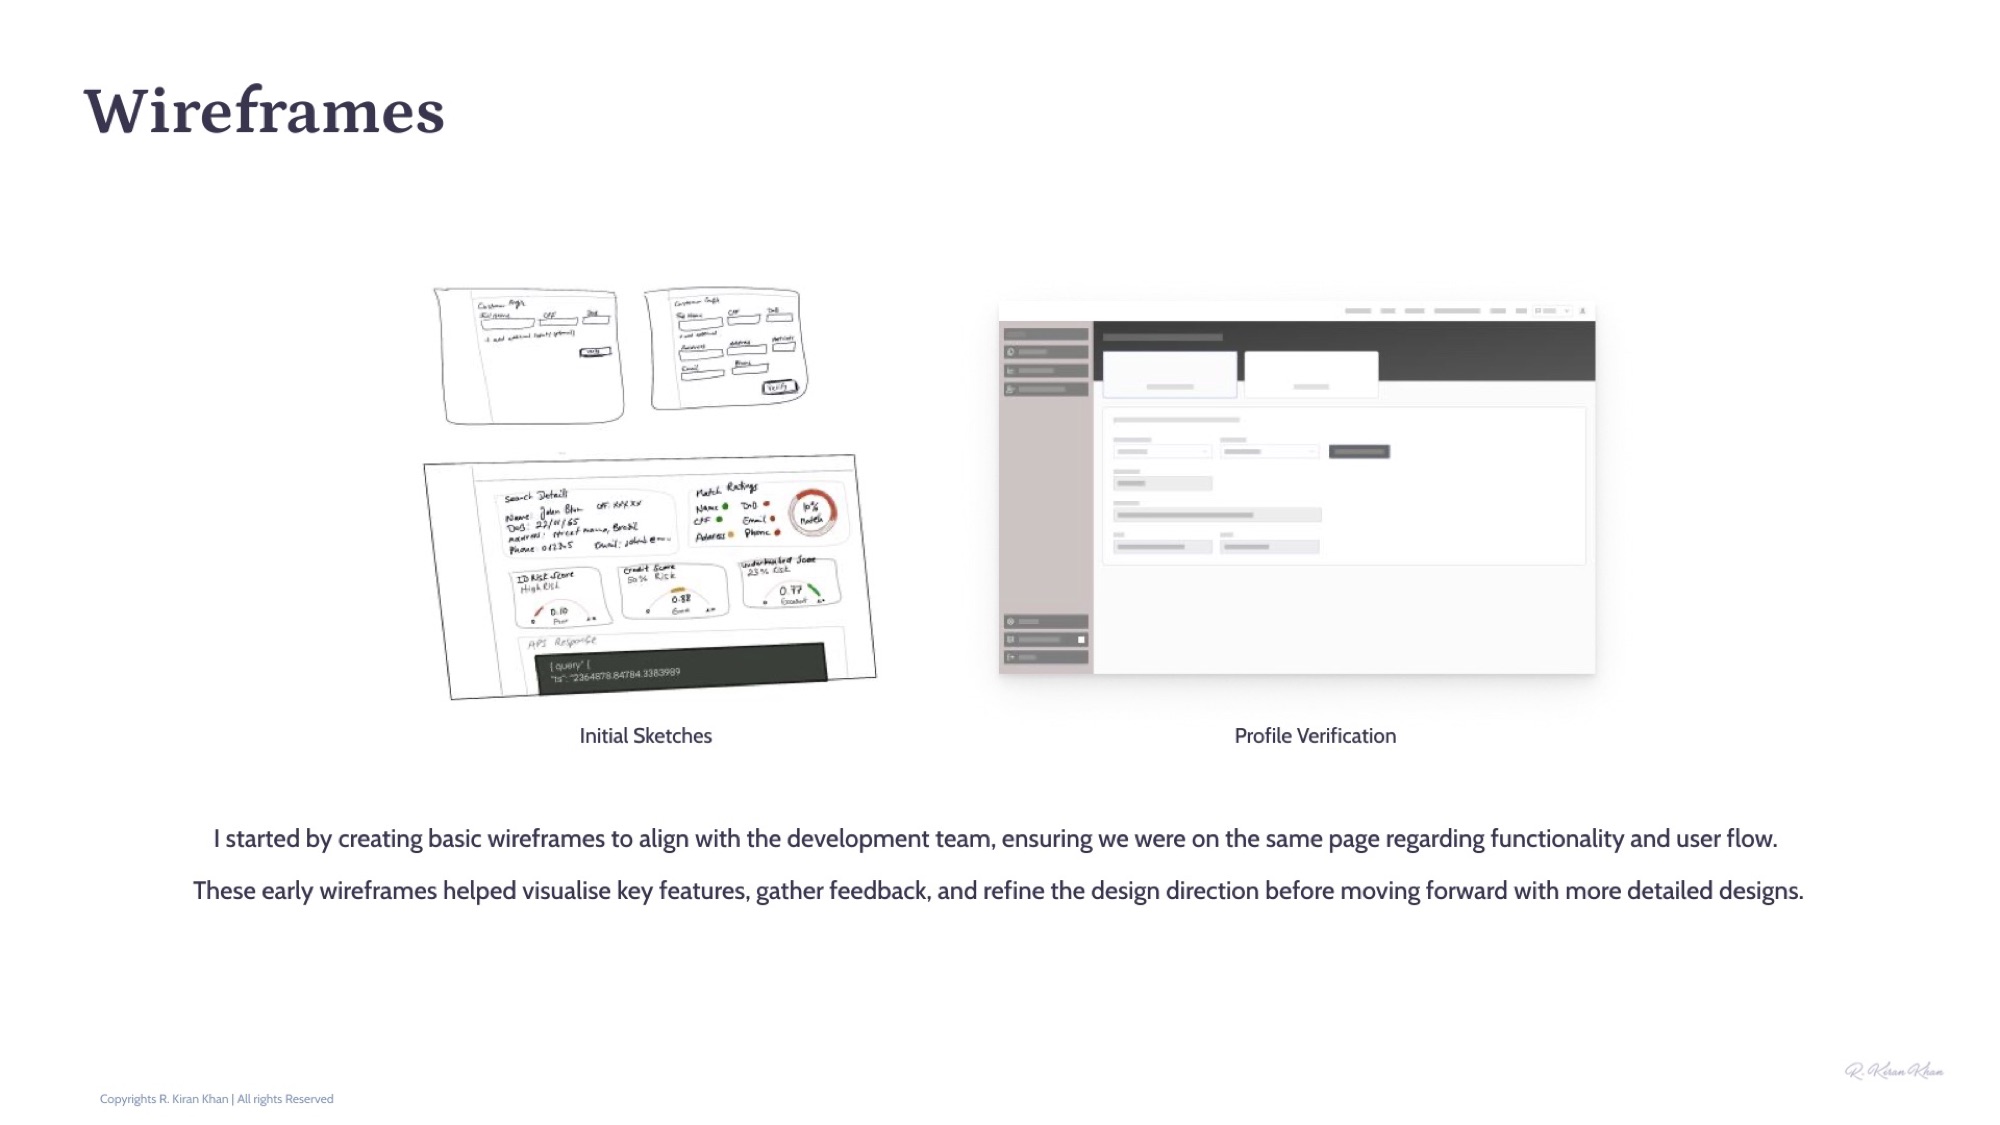
Structure first, screens second.
Mapped a clear navigation flow from login to dashboard, with a sidebar for primary features (insights, batch tests, API tools) and a top menu for docs, support, and account. Wireframes aligned engineering and design before any high-fidelity work began.
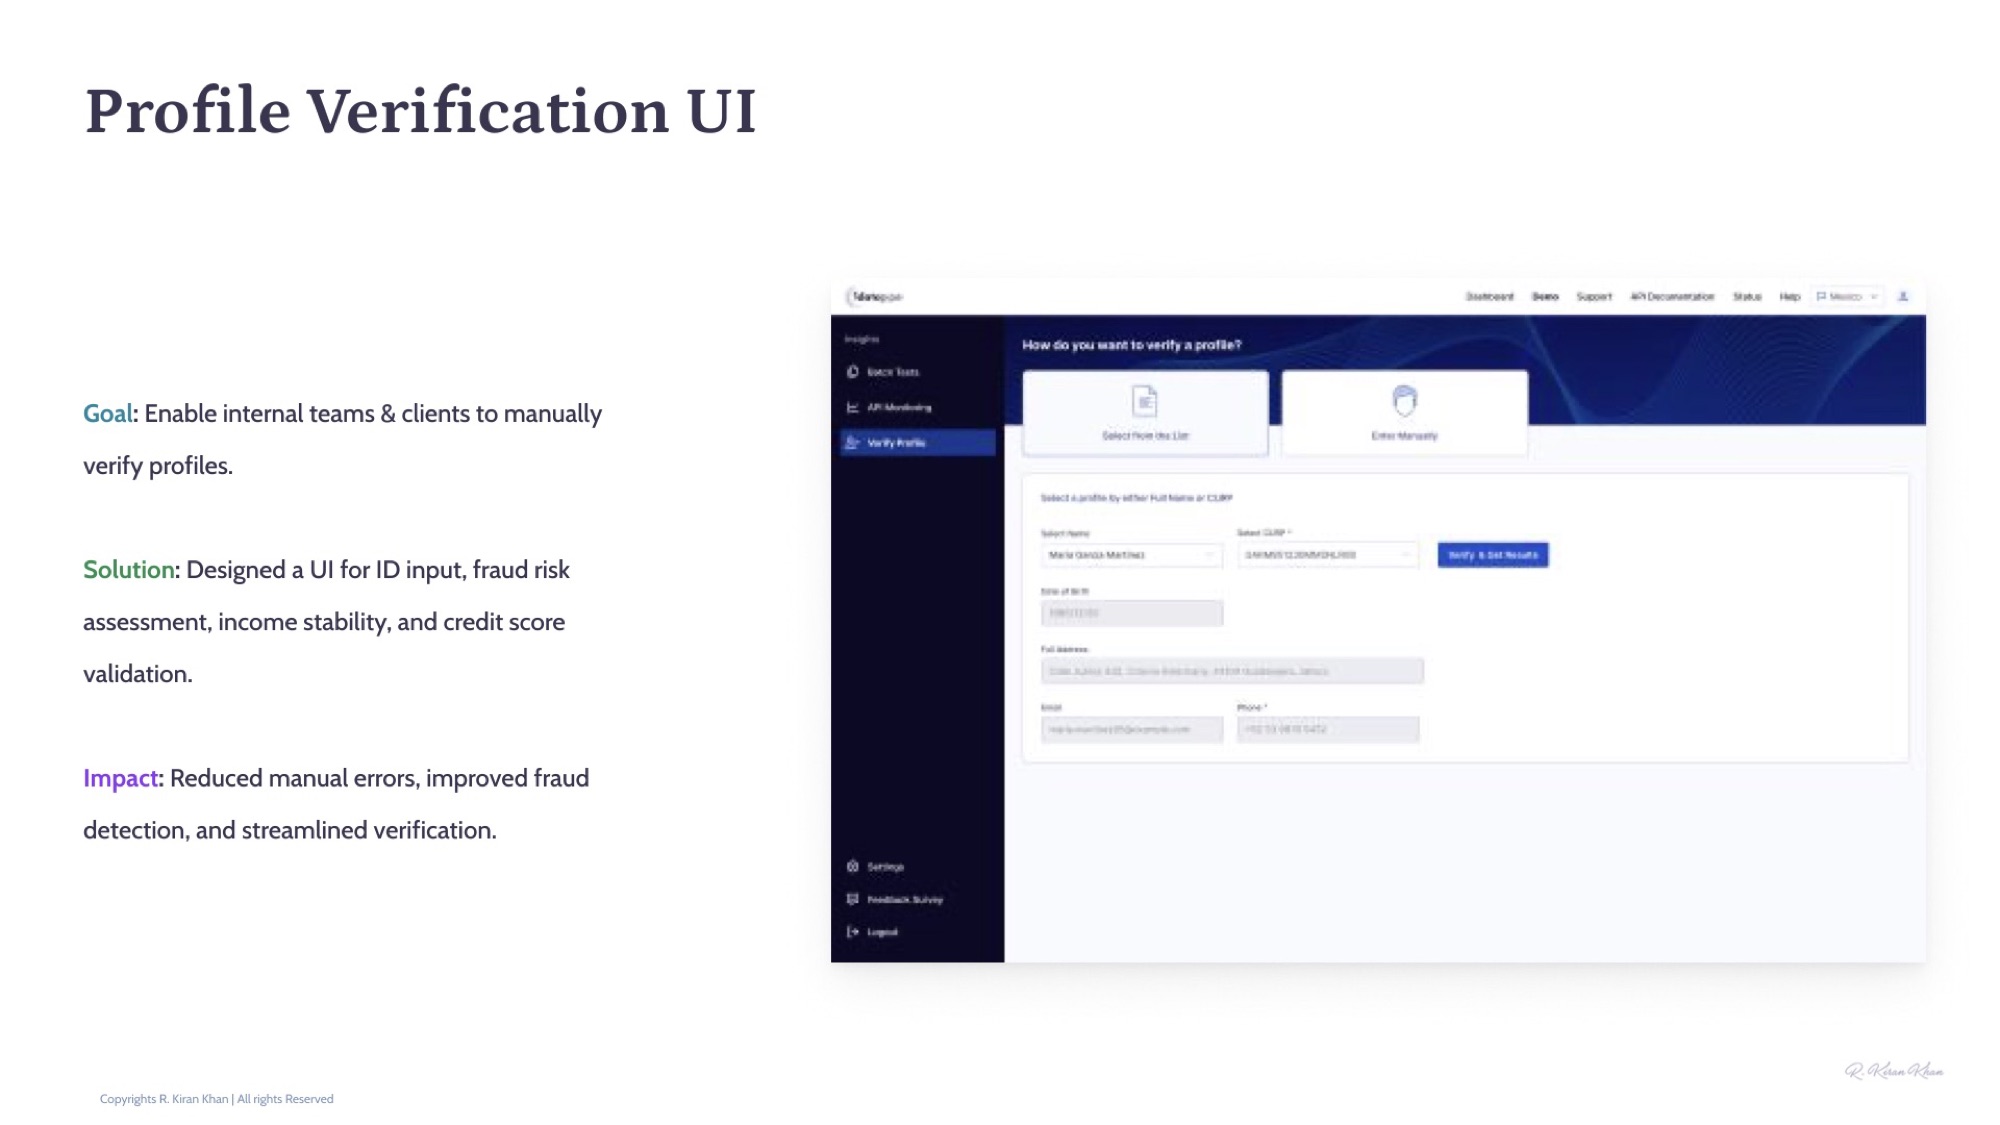
Profile verification & scores
Scores you can act on in seconds.
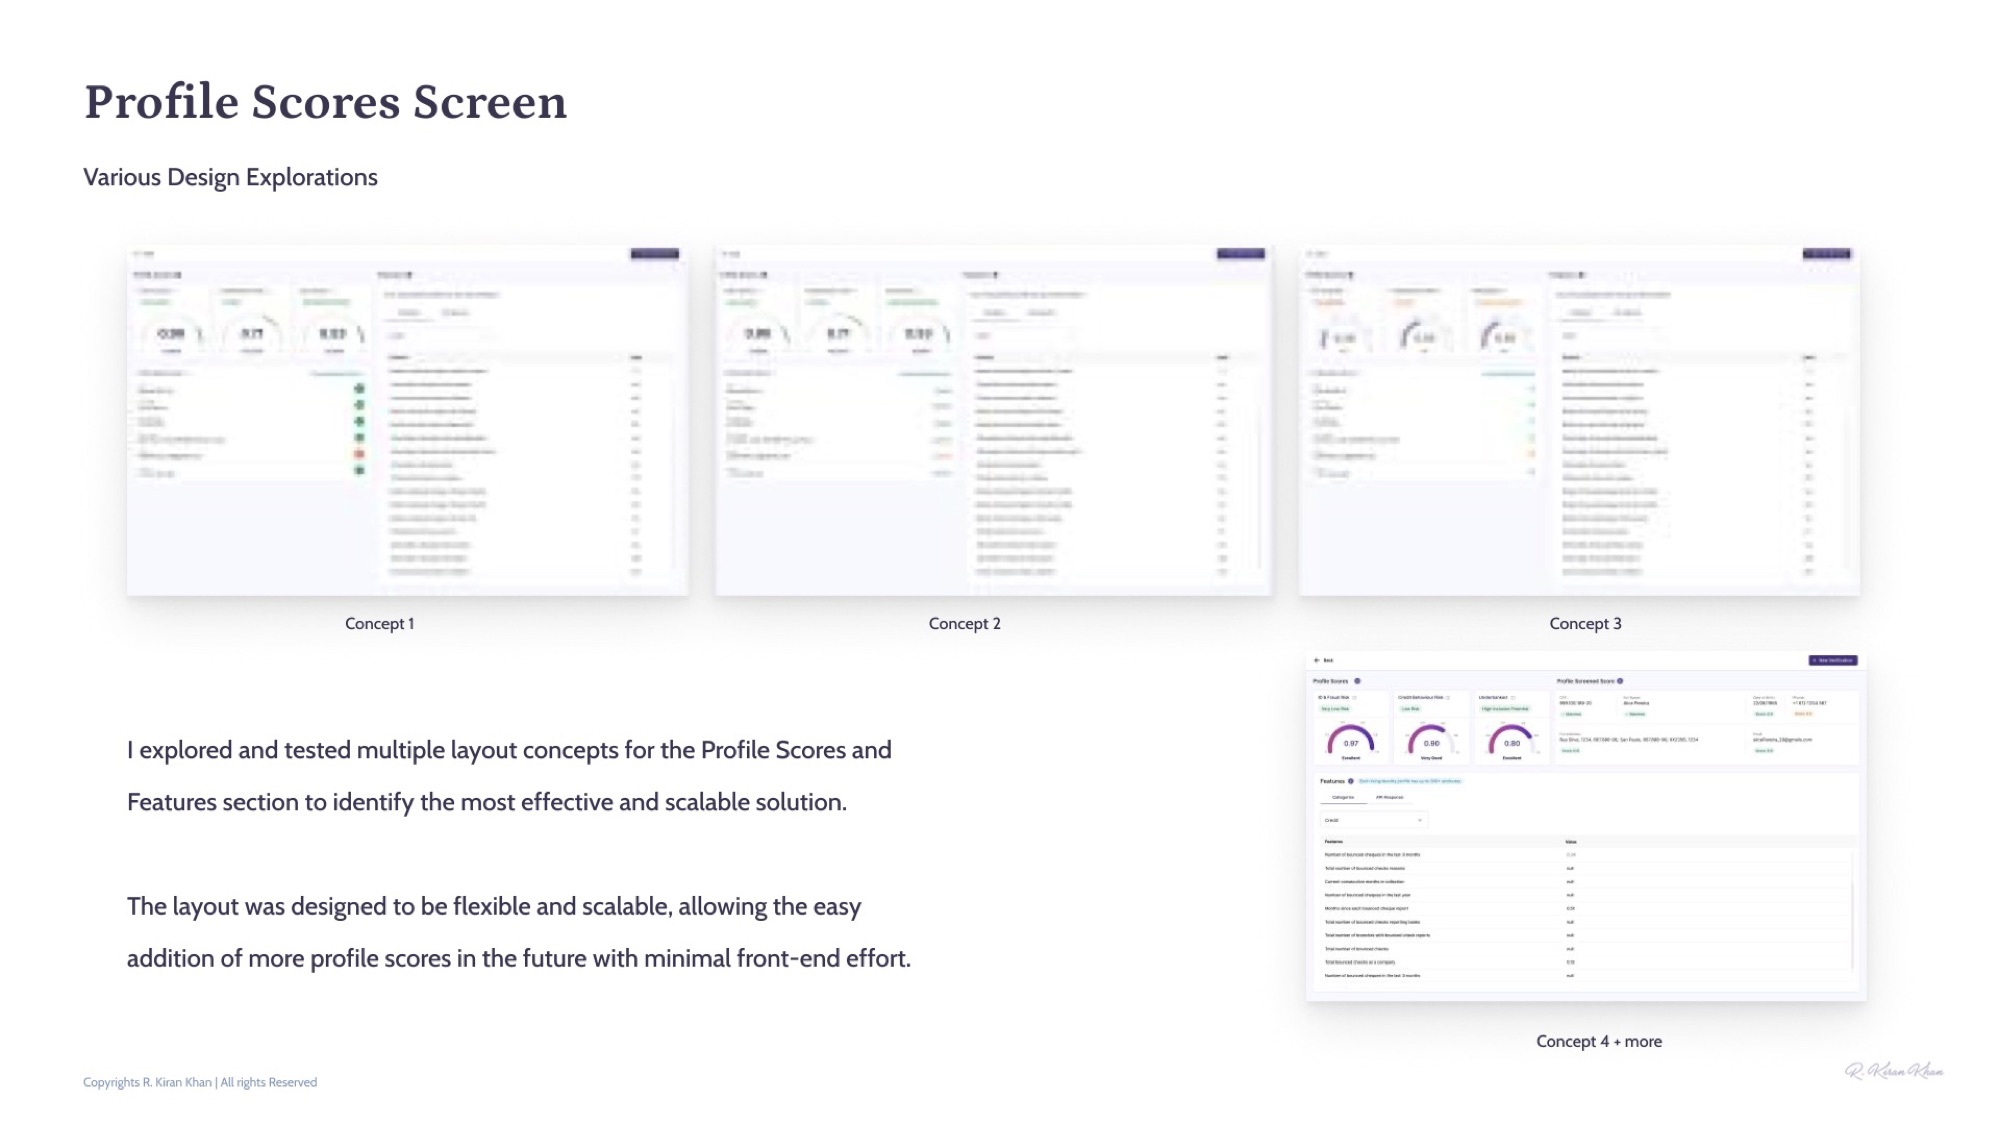
Designed the profile-verification UI for ID input, fraud risk, income stability, and credit-score validation — reducing manual errors and accelerating fraud detection. Multiple layout concepts for the Profile Scores screen were prototyped and tested before settling on a flexible, scorecard-led layout that scales as new score types are added.
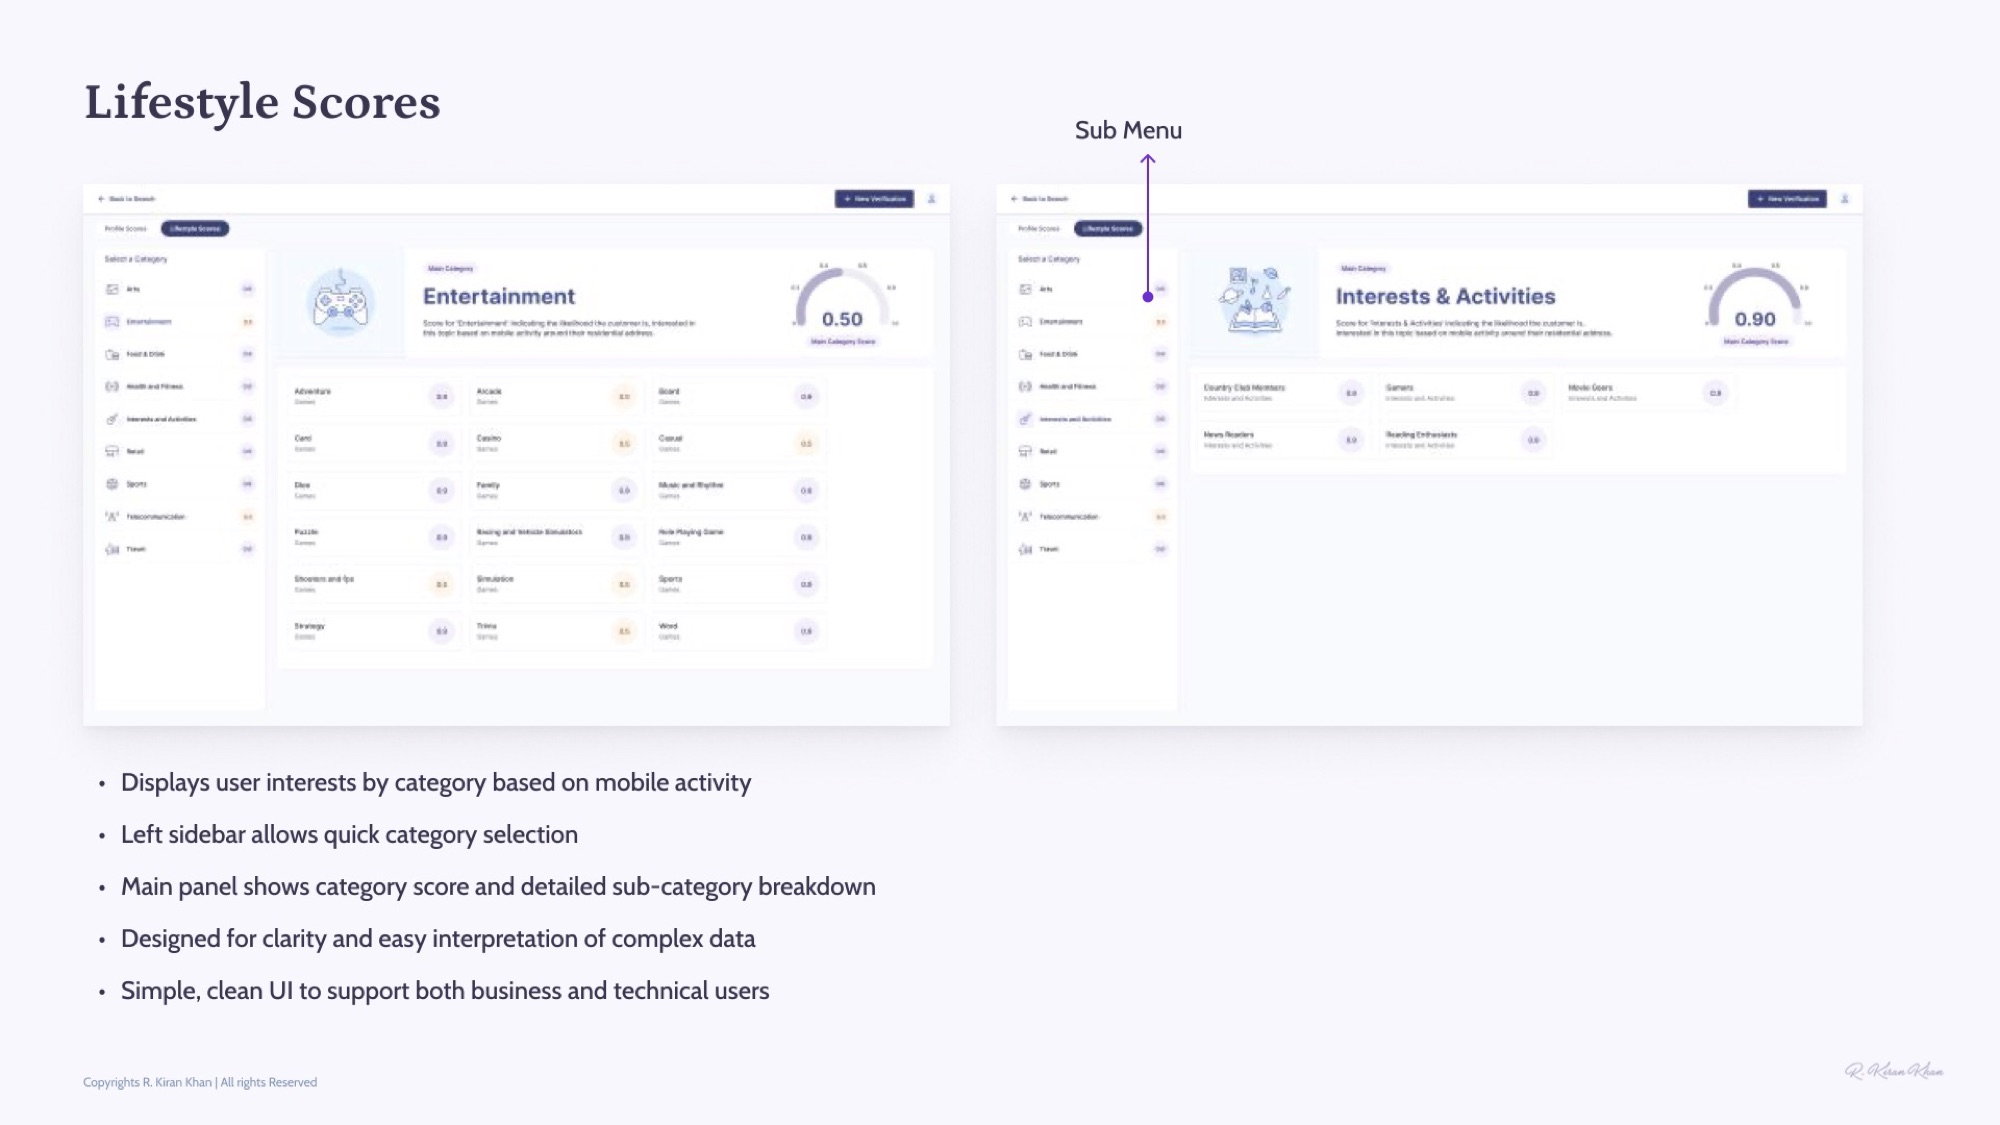
Lifestyle scores
Complex data, simply read.
The Lifestyle Scores submenu surfaces user interests by category, derived from mobile activity. A left sidebar for category navigation, a main panel for category score and sub-category breakdown — designed to be readable by both business and technical users.
Batch processing
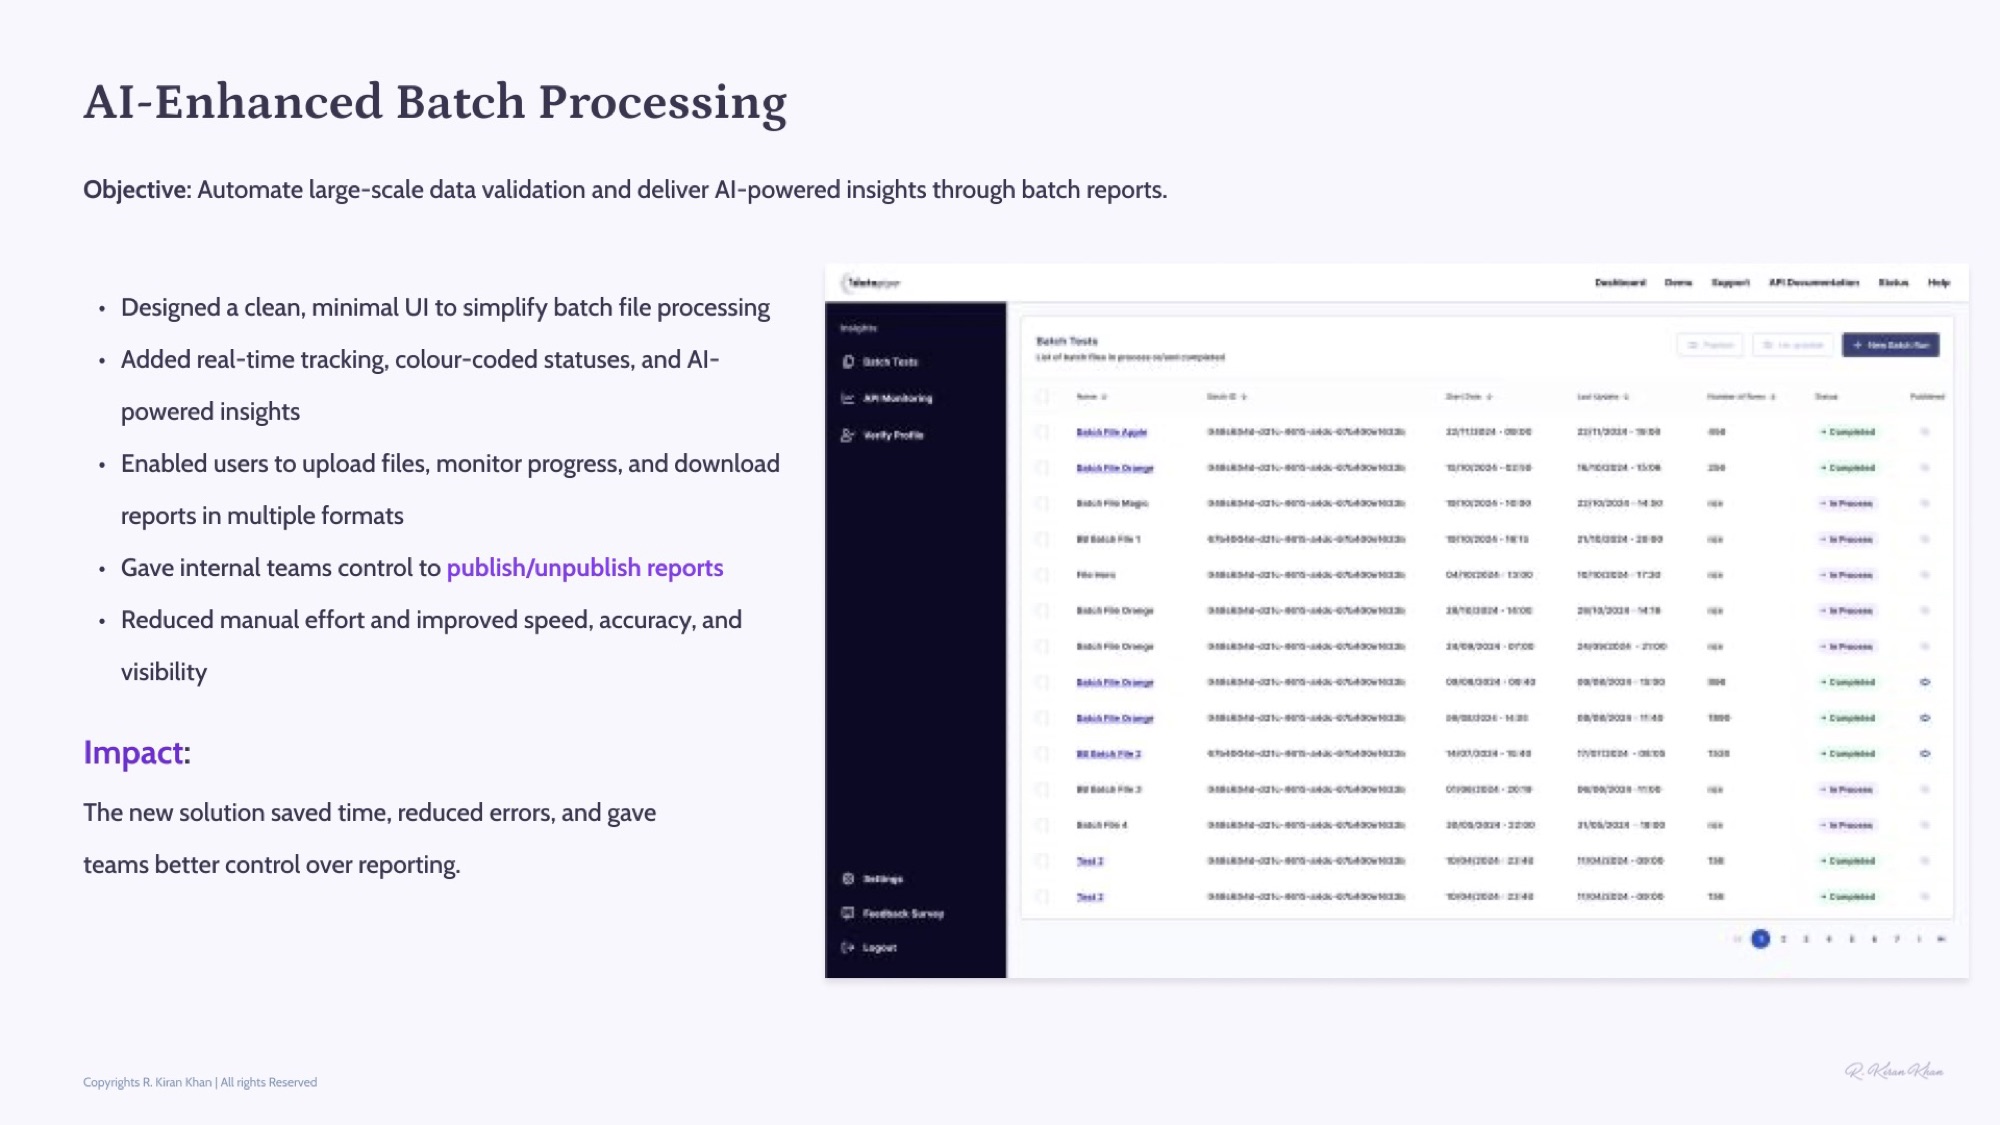
From manual work to a self-serve dashboard.
The existing batch-reporting workflow was the data-science team’s slowest, most error-prone process. Replaced it with a self-serve dashboard with file uploads, real-time tracking, colour-coded statuses, AI-powered insights, and multi-format downloads. Internal teams kept control to publish or unpublish reports as needed.
API monitoring
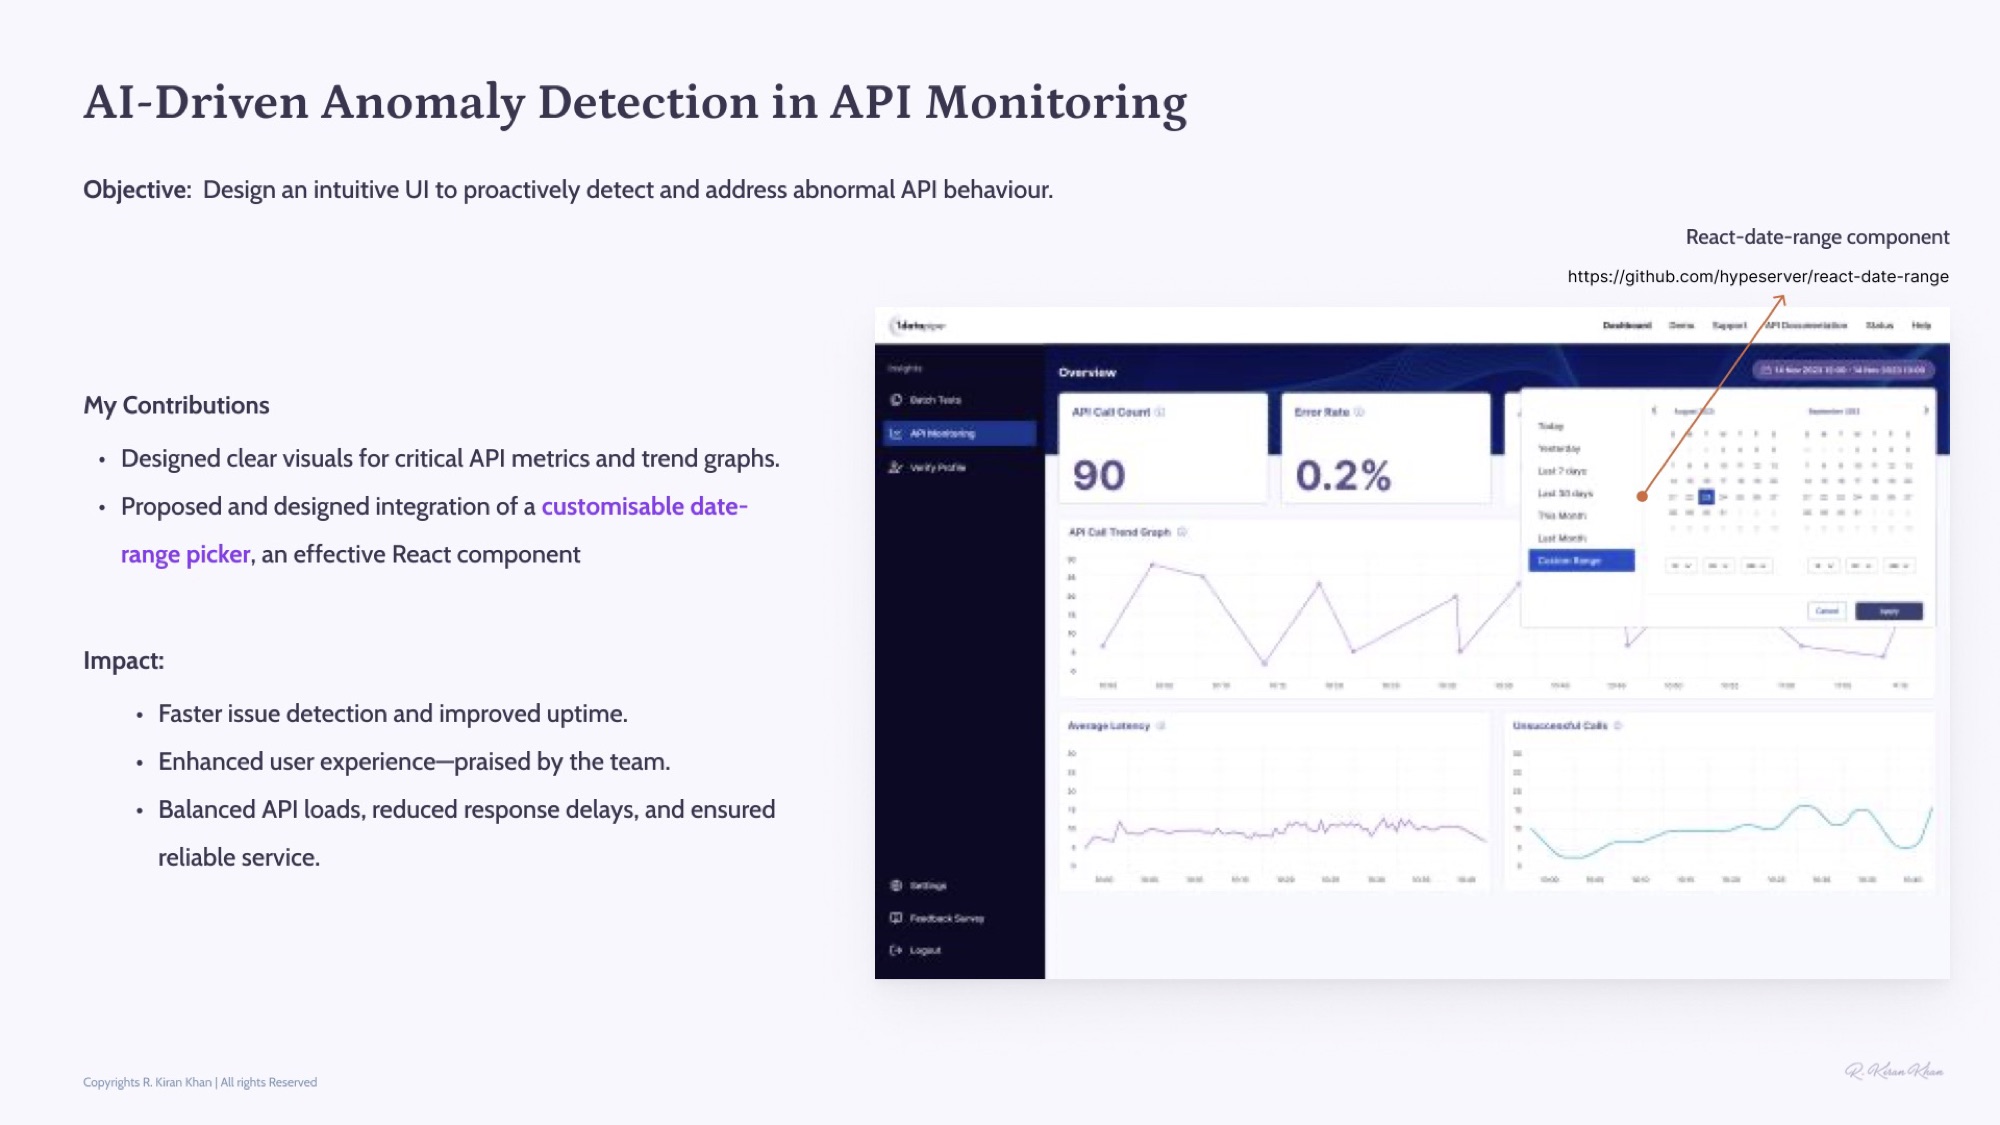
AI-driven anomaly detection.
Designed clear visuals for the critical API metrics and trend graphs, then proposed integrating a customisable date-range picker (React-date-range) so users could focus investigation windows. Result: faster issue detection and improved uptime.
Design system
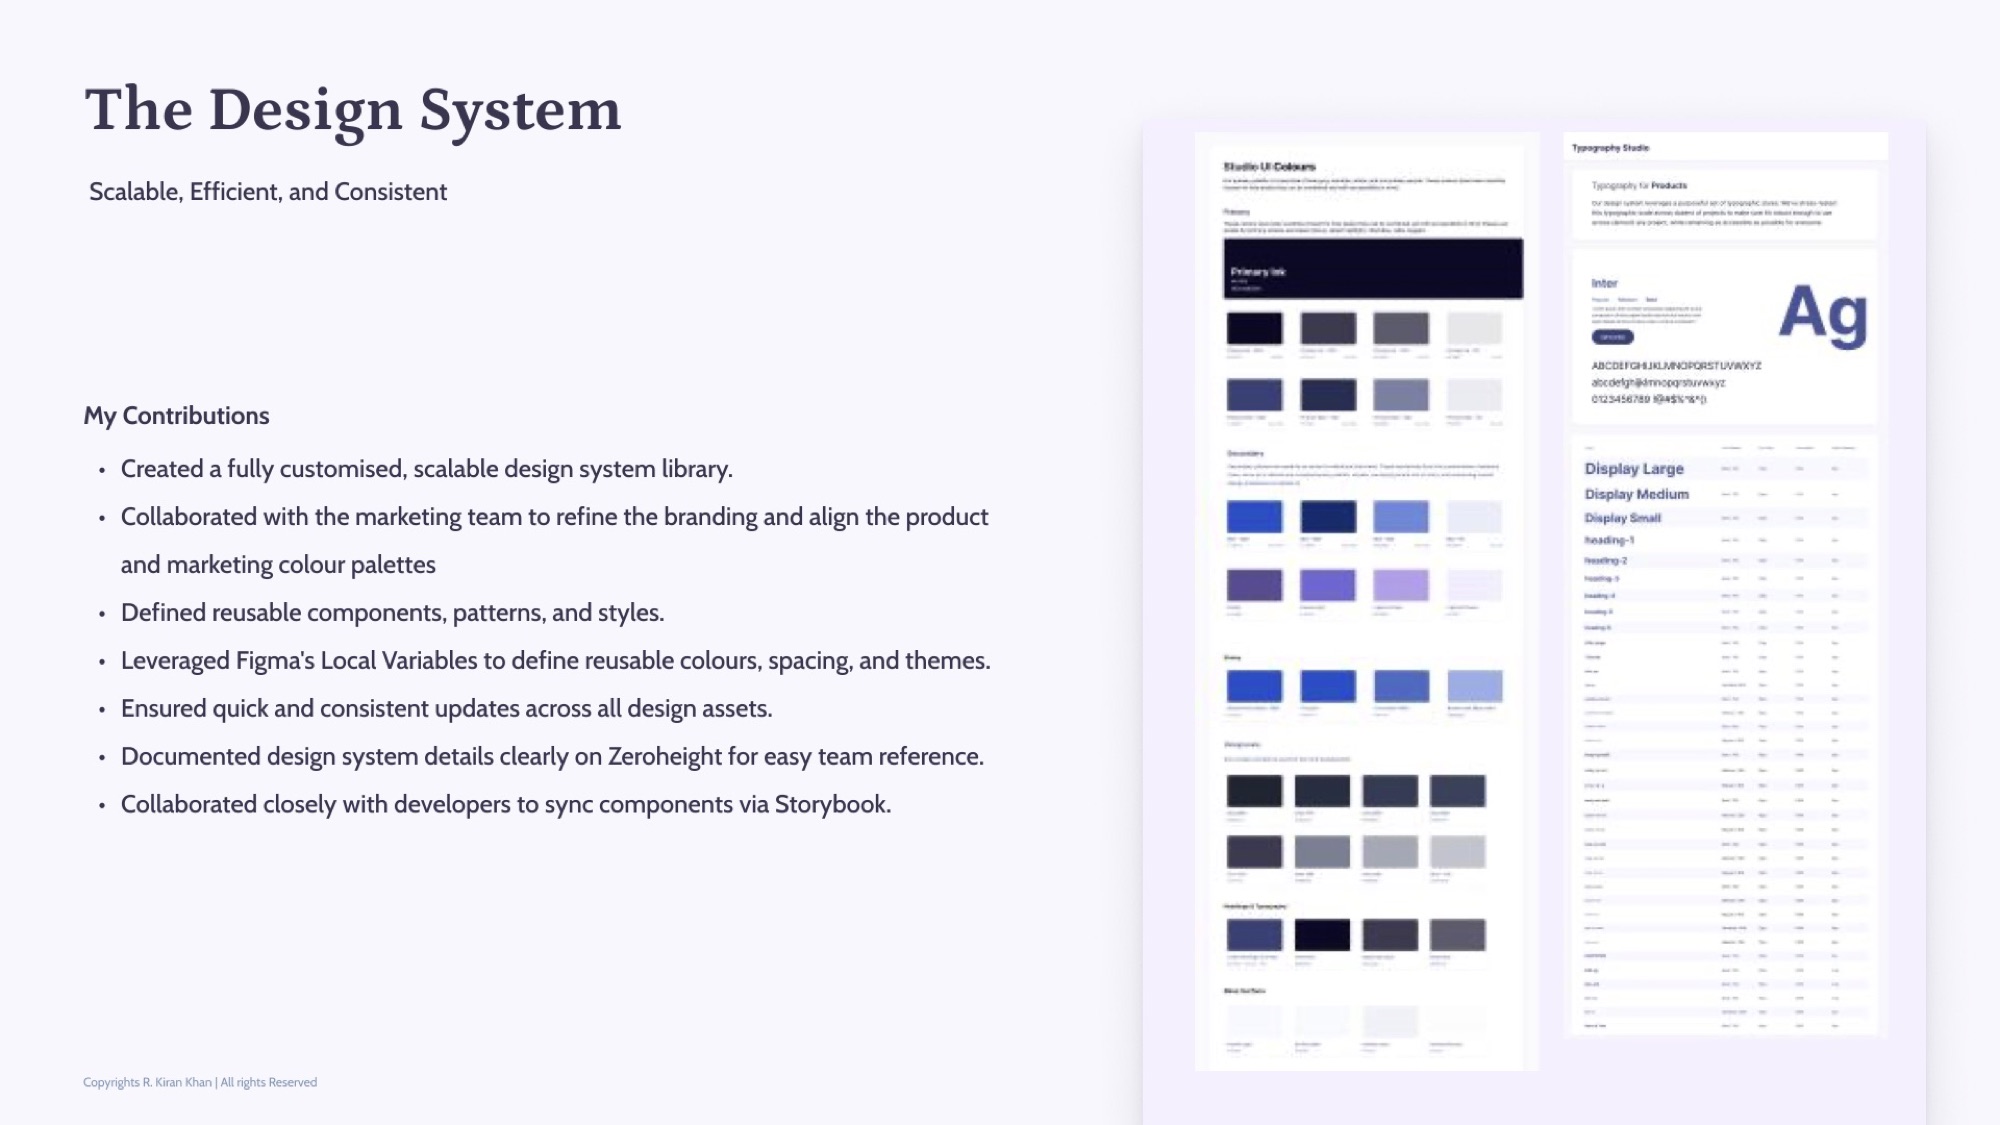
Scalable, efficient, consistent.
Built a fully customised, scalable design system. Worked with marketing to align the product and brand colour palettes. Defined reusable components, patterns, and styles in Figma using Local Variables for tokens (colours, spacing, type), documented in Zeroheight, delivered as components in Storybook.
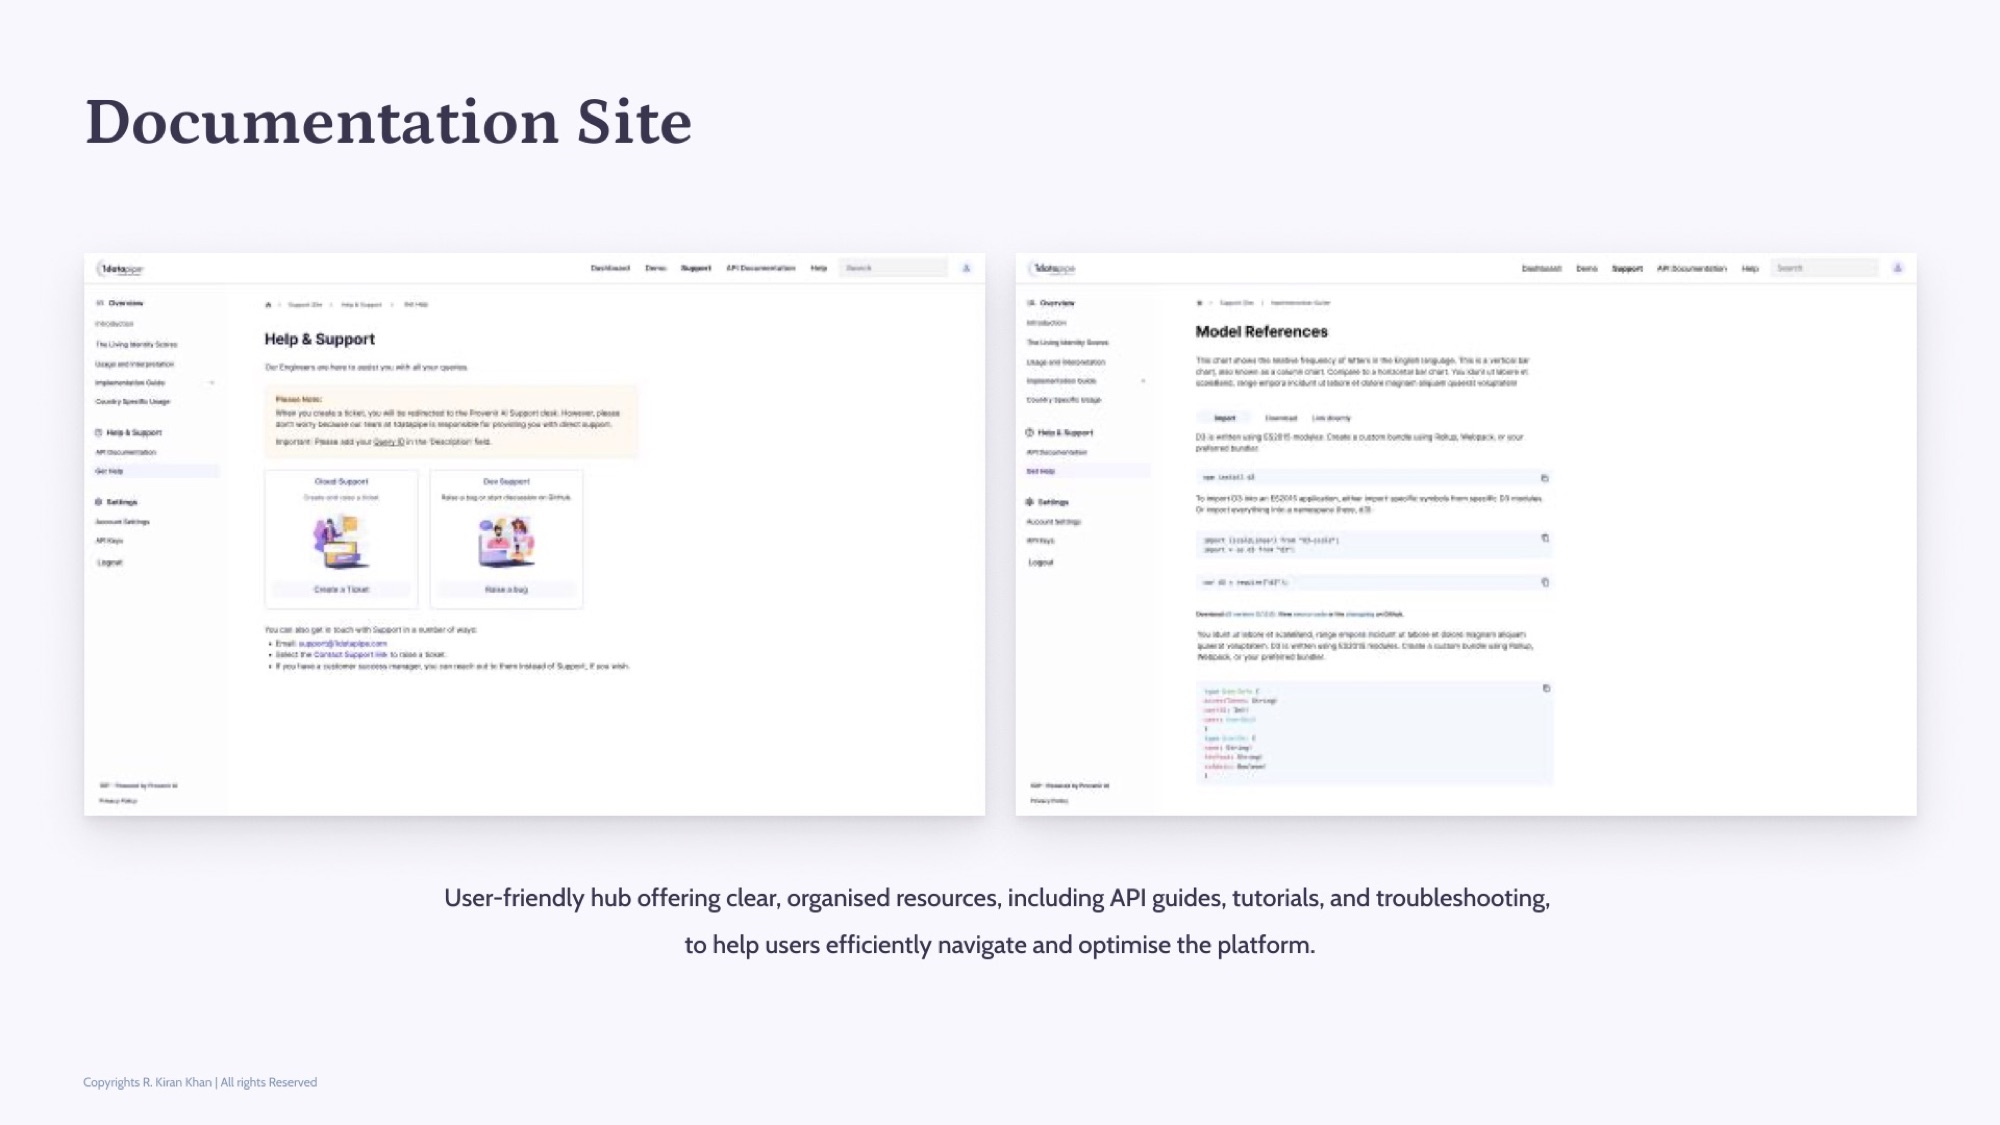
Documentation hub
Built for the technical persona.
A user-friendly hub for clear, organised resources — API guides, tutorials, troubleshooting — so technical users could self-serve and engineers stopped fielding repeat questions.
Business impact
Faster ship, lower onboarding cost, real adoption.
- Time-to-market −80%
- Streamlined design processes cut delivery time for new features dramatically across the platform.
- UI rollout +100%
- Reusable system + token-based components accelerated UI development and feature rollout across the team.
- Consistency at brand level
- Improved consistency across every surface, building brand recognition and B2B client trust during evaluation.
- Scalable foundation
- The design system became a flexible, reusable foundation for the platform's continued growth.
Reflection
“An API doesn’t sell itself. Two audiences, one design system, four AI-powered surfaces — and a B2B platform people actually want to onboard onto.”